Unlock the Power of Statistical Thinking
Statistics are everywhere, shaping everything from video game design to public health policies. While numbers themselves don’t lie, misunderstanding how they’re used can lead to incorrect conclusions. This guide will help you navigate the world of statistics, enabling you to interpret data more effectively and make more informed decisions.
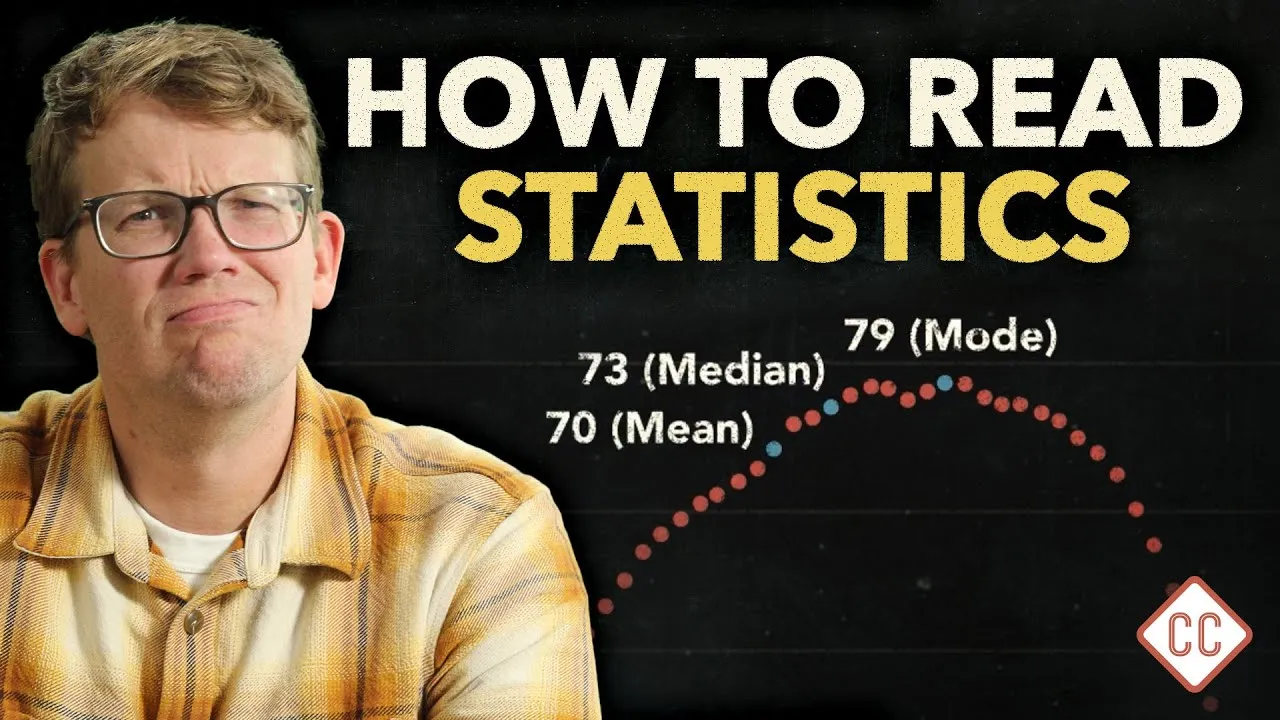
You’ll learn how to differentiate between various measures of central tendency like mean, median, and mode, understand the significance of standard deviation, and grasp the concept of confidence intervals. We’ll also explore the crucial difference between absolute and relative risk, and demystify correlations, confounding variables, and statistical significance.
Understanding Measures of Central Tendency
Scientists use samples to understand larger groups, but this introduces uncertainty. To describe what’s ‘typical’ in a dataset, we can use different statistical measures. It’s important to know how each one works to get the most accurate picture.
Calculate the Mean (Average)
The mean is the sum of all numbers in a dataset divided by the count of those numbers. It’s a common way to find an average.
However, the mean can be significantly influenced by extreme values (outliers) in the data. For example, if a few people die at a very young age, it can pull the average age of death down considerably.
Example: If the ages of death for a group are 10, 70, 75, 80, and 85, the mean is (10+70+75+80+85)/5 = 66. The ’10’ significantly lowers the average.
Identify the Mode
The mode is the number that appears most frequently in a dataset. It represents the most common value. In the context of age of death, the mode might represent the most frequent age at which people in a specific group die.
Example: In the dataset {10, 70, 70, 80, 85}, the mode is 70.
Determine the Median
The median is the middle value in a dataset when all the numbers are arranged in order. If there’s an even number of data points, the median is the average of the two middle numbers. The median is less affected by outliers than the mean, making it a more robust measure of central tendency when the data might be skewed.
Example: In the dataset {10, 70, 75, 80, 85}, the median is 75 (the middle number). In the dataset {10, 70, 75, 80, 85, 90}, the median is (75+80)/2 = 77.5.
Understanding Data Spread and Certainty
Knowing the ‘typical’ value is useful, but understanding how spread out the data is provides crucial context.
Interpret Standard Deviation
Standard deviation measures how spread out the numbers in a dataset are from the mean. A small standard deviation indicates that most data points are clustered close to the mean, suggesting the mean is a representative value. A large standard deviation means the data points are more spread out, indicating greater variability.
Expert Note: When a standard deviation is small, it implies that the ‘typical’ value (like the mean) is a good representation of the individual data points. Conversely, a large standard deviation suggests that individual data points might differ significantly from the mean.
Understand Confidence Intervals
A confidence interval provides a range of values within which a statistic is likely to fall, with a certain level of confidence. For example, a 95 percent confidence interval means that if the study were repeated 100 times with new samples, the result would fall within that range approximately 95 times. This tells you how precise your estimate is and how much trust you can place in it.
Key Takeaway: Every statistic has two parts: the number itself and how precisely scientists know that number. It’s often better to be roughly right than precisely wrong.
Distinguishing Risk and Understanding Relationships
Statistics can sometimes be presented in ways that sound alarming but lack crucial context. Understanding different types of risk and how variables relate is key to accurate interpretation.
Differentiate Between Absolute and Relative Risk
Relative risk compares the likelihood of an event occurring in one group versus another. An increase in relative risk, even if small in absolute terms, can sound dramatic. Absolute risk, on the other hand, is the actual number of people experiencing an event in relation to the total population at risk. It provides a clearer picture of the true magnitude of the risk.
Example: A birth control pill increasing the risk of blood clots by 100 percent sounds alarming. However, if the initial risk was 1 in 7,000 (absolute risk), a 100 percent increase means the new risk is 2 in 7,000. While still important, this context is vital for informed decision-making, especially when compared to the risks of other factors like pregnancy.
Understand Correlations
A correlation describes a relationship between two or more variables. The r-value, ranging from -1 to 1, quantifies the strength and direction of this relationship: 1 indicates a perfect positive relationship, -1 a perfect negative relationship, and 0 no relationship.
- Positive Correlation: As one variable increases, the other also increases (e.g., higher ice cream sales and higher rates of shark attacks).
- Negative Correlation: As one variable increases, the other decreases (e.g., higher rates of sunscreen use and lower rates of skin cancer).
Recognize Causation vs. Correlation
Crucially, correlation does not equal causation. Just because two variables are related doesn’t mean one causes the other. In the ice cream and shark attack example, warm weather likely causes both increases.
Confounding Variables: These are factors that can influence the outcome of a study without being controlled for, potentially blurring the true relationship between variables. For instance, wealth might influence both health outcomes and beach visits, creating a spurious correlation.
Assess Statistical Significance
Statistical significance indicates that a result is unlikely to have occurred by random chance. In science, ‘significant’ doesn’t necessarily mean ‘important’ or ‘meaningful in the real world.’ It simply means the observed result is strong enough to warrant further investigation, as it’s improbable it happened randomly.
Tip: Always consider whether a statistically significant result also has practical or real-world importance.
Conclusion: Embracing Uncertainty
Statistics are powerful tools that help us understand uncertainty and make sense of the world. By understanding the nuances of different statistical measures, risk reporting, and the difference between correlation and causation, you can become a more critical and informed consumer of scientific information. This understanding not only helps you appreciate how science works but also empowers you to make better decisions in your own life.
Source: Statistical Thinking in Science: Crash Course Scientific Thinking #2 (YouTube)