Discover the Magic Behind M.C. Escher’s “The Print Gallery”
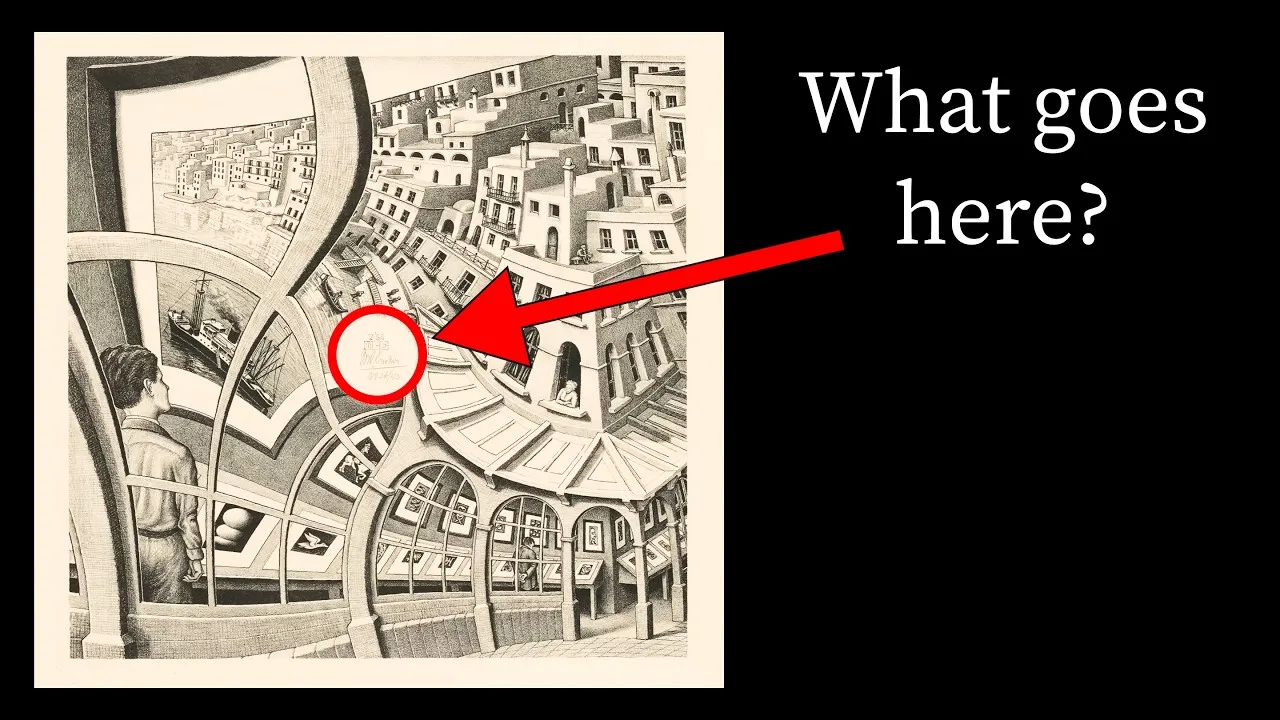
M.C. Escher’s artwork often puzzles and amazes viewers with its impossible perspectives and repeating patterns. His 1956 lithograph, “The Print Gallery,” is a prime example, featuring a young man looking at a print that seems to contain the entire scene, including himself. This artwork presents a mind-bending loop that has fascinated mathematicians. This article will guide you through the artistic and mathematical concepts Escher used to create this masterpiece, making complex ideas easy to understand.
What You’ll Learn
- How Escher created the self-referential loop in “The Print Gallery.”
- The artistic technique of mesh warping and its role in Escher’s work.
- The mathematical concept of conformal maps and why they are special.
- How complex numbers and logarithms help explain the artwork’s structure.
Prerequisites
No advanced math knowledge is required. The article explains concepts like complex numbers and logarithms in simple terms. However, a basic understanding of geometry and art can be helpful.
Step 1: Understanding the “Droste Effect”
Escher’s “The Print Gallery” relies on a concept similar to the “Droste effect.” This is when an image contains a smaller version of itself, which in turn contains an even smaller version, and so on. Think of a cocoa box showing a picture of a woman holding a tray with the same cocoa box on it.
Escher took this idea much further. His artwork creates a continuous zoom effect. As you look around the picture, the world seems to warp and zoom in. This creates a self-contained loop where the image seems to contain itself infinitely.
Intuitive Steps to Escher’s Loop
Escher didn’t start with complex math. He began with a simpler idea and then warped it. Here’s a breakdown of how he might have approached it:
- Start with a Straightened Image: Imagine a picture that clearly shows a man looking at a framed artwork. Inside that artwork is a harbor, then a town, then a gallery, and inside that gallery is the man again. This is a “straight” version of the Droste effect, where the zoom is obvious and linear. Escher used a version where the inner image was 256 times smaller than the outer one.
- Create a Warped Grid: To turn the linear zoom into a circular warp, Escher used a special grid. This grid doesn’t look like normal graph paper. Its lines curve and spread out in a very specific way. Think of it like a funhouse mirror grid. If you look at a small square in one corner of this grid, and then follow its lines to another corner, the area enclosed by those lines will be much larger. This grid mathematically encodes how much the image should stretch or shrink in different directions. For “The Print Gallery,” the grid was designed so that moving from one corner to the next would involve a scaling factor of four.
- Use the Grid to Warp the Image: The final step is to use the warped grid to transform the straightened image. Imagine overlaying a normal grid onto your original, straight picture. Then, you copy the contents of each small square from the normal grid onto the corresponding, but warped, square in Escher’s special grid. Because the warped grid stretches and shrinks in specific ways, the final image gets distorted into the circular, looping effect. This process makes sure that as you move around the final image, you are effectively zooming in, creating the illusion of a continuous loop.
Step 2: The Power of Mesh Warping
The technique of using a warped grid to distort an image is known as “mesh warping.” Artists use this method to bend and shape images in creative ways. Escher was a master of this technique, applying it to create complex illusions.
In “The Print Gallery,” the warped grid is key. It ensures that the image seamlessly loops back on itself. The grid lines are carefully designed to create a smooth transition, making the impossible perspective feel natural.
Step 3: Understanding Conformal Maps
What makes Escher’s grid so special? The tiny squares within his warped grid remain, at a small scale, approximately square. This property is crucial and has a special name in mathematics: a “conformal map.”
Think of a regular map of the world. When you flatten a sphere onto a flat surface, shapes get distorted, especially near the poles. Conformal maps, however, preserve angles and shapes locally. This means that even though the overall image is dramatically warped, if you zoom in on any small part of “The Print Gallery,” it looks relatively normal and undistorted. This is why the details in the village and the gallery are still recognizable.
Why Conformal Maps Are Special
In mathematics, functions that create conformal maps are very rare and powerful. They are often related to complex numbers. When you use complex numbers, functions can scale and rotate, but they preserve shapes at a small scale. This is different from regular 2D geometry, where transformations often squish and distort shapes.
The math behind this involves calculus and derivatives. Essentially, at a very small level, the transformation behaves predictably, like stretching or rotating a tiny square without changing its basic squareness.
Step 4: Exploring Complex Numbers and Logarithms
To truly understand the grid Escher used, we need to step into the world of complex numbers. Complex numbers have a real part and an imaginary part, plotted on a two-dimensional plane.
Functions involving complex numbers can do more than just scale and rotate. They can create intricate transformations. For example, squaring a complex number can warp a grid dramatically, yet it still maintains the conformal property locally.
The Role of the Exponential Function
A key function in complex numbers is the exponential function, e^z. When the input ‘z’ is a complex number, this function has a unique behavior. The imaginary part of ‘z’ makes the output ‘walk around a circle.’ The real part of ‘z’ controls the size of that circle.
A fascinating aspect is that multiple inputs can lead to the same output. For instance, e^0 and e^(2πi) both equal 1. This means the exponential map is “many-to-one.” This property is essential for creating the looping effect.
Unwrapping Circles with the Natural Logarithm
The inverse of the exponential function is the natural logarithm (ln). If the exponential function turns lines into circles, the natural logarithm does the opposite: it unwraps circles back into lines.
Imagine applying the natural logarithm to a picture. If you think of the picture’s pixels as complex numbers, the natural logarithm would transform circles of pixels into straight lines. This is how mathematicians De Smit and Lenstra analyzed Escher’s work, showing how the logarithmic transformation could explain the warped grid.
By understanding how circles become lines (and vice versa) through these complex functions, mathematicians could reverse-engineer the grid Escher used. This process reveals the deep mathematical structure hidden within “The Print Gallery,” showing how Escher intuitively created a work that aligns with advanced mathematical concepts.
Conclusion: The Art of Mathematical Illusion
M.C. Escher’s “The Print Gallery” is more than just a clever drawing; it’s a visual representation of profound mathematical ideas. By using techniques like the Droste effect and mesh warping, combined with an intuitive grasp of concepts related to conformal maps and complex logarithms, Escher created a masterpiece that continues to inspire and challenge us.
The next time you see “The Print Gallery,” you’ll appreciate the intricate dance between art and mathematics that makes this image so uniquely captivating. It shows how art can explore complex ideas, and how math can describe the most beautiful and puzzling illusions.
Source: This picture broke my brain (YouTube)