How to Create Stunning AI Infographics in Minutes with Pictochart
Infographics are a fantastic way to present complex information in an easy-to-understand and visually appealing format. However, creating them from scratch can take a lot of time and effort. Fortunately, artificial intelligence (AI) has made this process much simpler and faster. This guide will show you how to use Pictochart’s AI tool to generate professional-looking infographics in just a few seconds, simply by using a text prompt.
What You’ll Learn
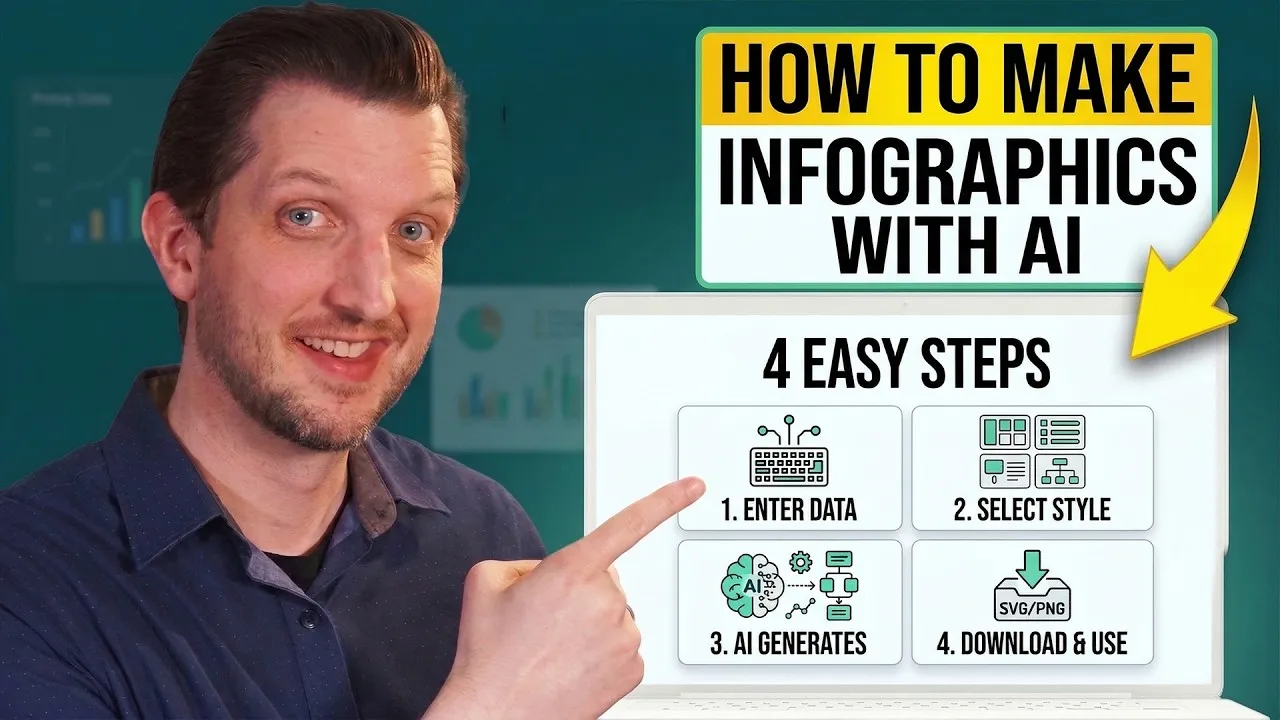
In this tutorial, you will learn how to:
- Sign up for a free Pictochart account.
- Use the AI Infographic Generator with a text prompt.
- Customize the AI-generated infographic with different designs and content.
- Edit text, colors, and images within the infographic.
- Download your finished infographic.
Prerequisites
- A computer with internet access.
- A free Pictochart account (which you’ll create in Step 1).
Step-by-Step Guide
Step 1: Sign Up for a Free Pictochart Account
First, you need to create an account on Pictochart. Go to the Pictochart website and look for the option to sign up for a free account. You can usually sign up using your email address or a Google account, whichever is easier for you. Follow the on-screen instructions to complete the account creation process. After signing up, Pictochart might ask you a few questions to personalize your experience. For example, it might ask what you’ll be using the tool for (like ‘work’ or ‘personal’) and your role (like ‘marketing’ or ‘education’). Answer these questions to help tailor the tool to your needs.
Step 2: Navigate to the Infographic Generator
Once your account is set up and you’re logged in, you’ll see a dashboard with various options. On the left-hand side of the screen, you’ll find a menu. Click on ‘Infographics’. This will take you to a section filled with different infographic templates. While you can choose a template to customize manually, we’re going to use the AI tool. Look for an option at the top that says ‘AI Infographic Generator’ and click on it. You might then need to select ‘Infographic’ from a list of AI creation options.
Step 3: Enter Your Text Prompt for the AI
You’ll now be on the AI infographic generation page. Here, you’ll see a text box where you can describe what you want your infographic to be about. This is your prompt. For example, you could type ‘Top 5 Digital Marketing Tips’. Below the main prompt box, there’s an optional section for ‘Additional Instructions’. This is where you can give the AI more details. You could specify the tone of the text (e.g., ‘write for beginners’), key points to focus on (e.g., ‘focus on social media’), or the target audience (e.g., ‘tips for business leaders’). The more specific you are, the better the AI can tailor the infographic to your needs. Add your prompt and any additional instructions.
Step 4: Generate Your Infographic
After you’ve entered your prompt and any extra instructions, click the ‘Generate Infographic’ button. The AI will then process your request. This usually takes only a few seconds. In no time, Pictochart will present you with a ready-made infographic based on your text. It will likely include a headline and break down the information into numbered points or sections, like ‘Tip Number One’, ‘Tip Number Two’, and so on.
Step 5: Choose a Design and Preview
The AI will generate an infographic with a default design. On the left-hand side of the editor, you’ll see a ‘Choose a Design’ option. Click on this to explore different visual styles. You can scroll through various pre-made designs and click on any that catch your eye. The infographic’s content will remain the same, but the layout, colors, and fonts will change instantly to match the new design. Take your time to click through a few options until you find a design you really like. You can always switch designs later if you change your mind.
Step 6: Save and Edit Your Infographic
Once you’re happy with the design, click the ‘Save and Edit Infographic’ button, usually found at the top of the page. This will open the infographic in a full editing mode, allowing you to make further changes. You can click on any text box to edit the content. For instance, you could change the main headline or rephrase specific tips. To change a headline, simply click on the text box and type your new text. Similarly, you can click on other text elements to update them. If you want to change colors, click on an element like the background, then look for a ‘Background and Patterns’ option at the top. From there, you can select a new color. You can also replace images by clicking on them and choosing to upload your own or generate a new image using AI prompts within the editor.
Step 7: Replace or Add Images
Images are crucial for making infographics engaging. If you want to change an existing image, click on it. You’ll likely see options to upload your own image or use the AI image generator again. If you choose to generate a new image, type a description for the image you want, like ‘people collaborating on a project’. Click ‘Generate Image’. Once you find an image you like, select it, and then look for an ‘Insert to Page’ button. Click this to replace the old image with your new AI-generated one. This ensures your infographic has the most relevant and visually appealing graphics.
Step 8: Preview and Download Your Infographic
Before finalizing, it’s a good idea to preview your work. Look for an ‘eye’ icon or a ‘Preview’ button, usually at the top of the editor. Clicking this will show you how the infographic will look without the editing guidelines. This helps you catch any final adjustments needed. Once you’re satisfied with the preview, exit the preview mode. Now, click the ‘Download’ button. Pictochart will offer different file format options, such as PNG or JPG. Choose the format that best suits your needs, usually PNG for high-quality graphics. Select your preferred quality settings and then click ‘Download’. The infographic will be saved to your computer, ready for you to use on your website, in presentations, or in marketing materials.
Source: How to Make Infographics AI Creates Them in Seconds (YouTube)