Mastering Stock Valuation: Beyond Price Tags
The timeless adage of “buy low, sell high” is a cornerstone of investing, yet discerning what constitutes a low or high price in advance remains a significant challenge for many. Simply comparing a stock’s price to everyday items or even substantial assets like houses is an oversimplification. True stock valuation requires a deeper, more analytical approach. This article delves into three key methods for assessing a stock’s true worth, drawing insights from seasoned investors like Warren Buffett and Benjamin Graham.
Relative Valuation: Comparing Apples to Apples
One of the most accessible methods is relative valuation, which involves comparing a company’s valuation metrics to its historical averages and to those of its peers in the same industry. This approach hinges on understanding valuation multiples.
The Power of the Price-to-Earnings (P/E) Ratio
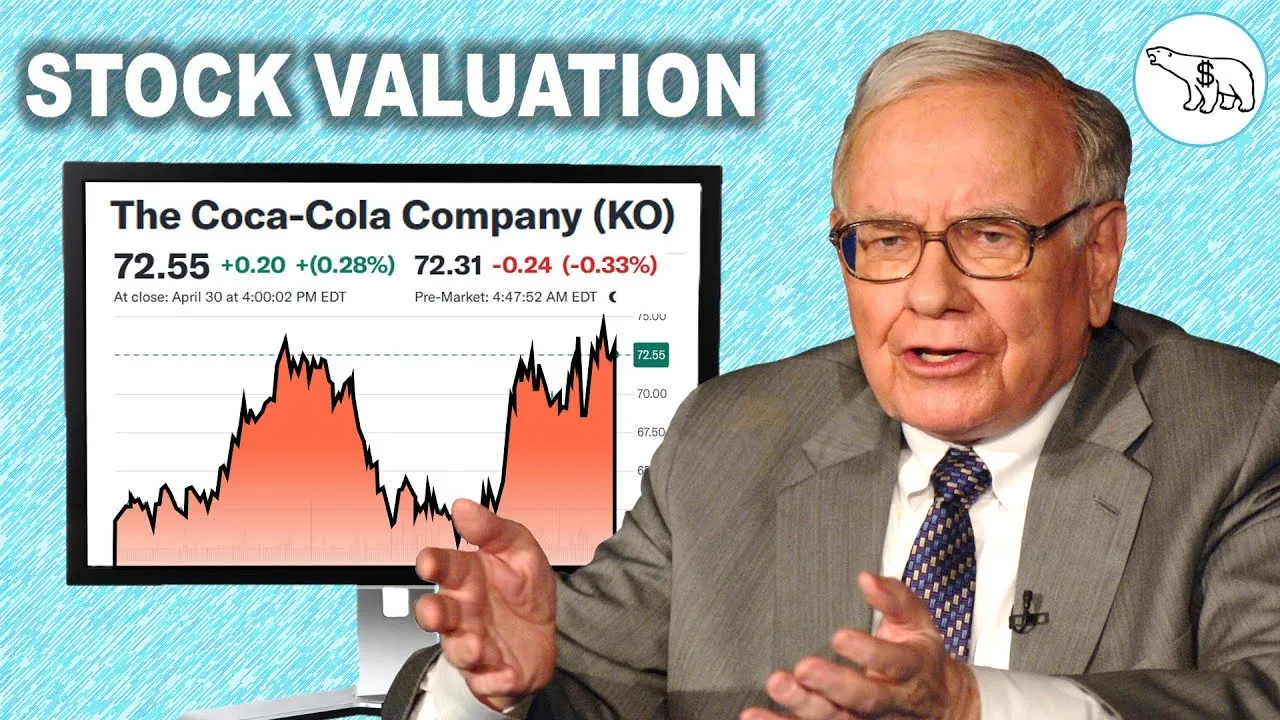
A fundamental metric is the Price-to-Earnings (P/E) ratio, calculated by dividing a company’s current stock price by its earnings per share. It essentially indicates how many years of earnings it would take for an investor to recoup their initial investment, assuming earnings remain constant. For instance, Coca-Cola, trading around $72 with earnings of $2.50 per share, has a trailing P/E ratio of approximately 28.8 years ($72 / $2.50).
However, relying solely on trailing P/E can be misleading as it’s backward-looking. The forward P/E ratio, which uses expected future earnings, offers a more forward-looking perspective. Analysts anticipate higher earnings for Coca-Cola, resulting in a forward P/E of around 24.3, lower than its trailing P/E.
Benchmarking Against History and Peers
To gauge whether a P/E ratio is attractive, investors compare it to the company’s historical P/E ranges and the P/E ratios of its competitors. Over the past decade, investors have typically been willing to pay around 23 times Coca-Cola’s future earnings (forward P/E of 23). With the current forward P/E at 24.3, Coca-Cola appears slightly expensive based on its own historical valuation.
Comparing Coca-Cola to its peers in the carbonated beverage industry—such as PepsiCo, Dr. Pepper, Monster, and AG Barr—reveals further insights. The average forward P/E for this group, including Coca-Cola, is approximately 21.3. If Coca-Cola were to trade at this average multiple, its stock price could potentially fall by about 12%.
Peer analysis can also uncover hidden gems. AG Barr, for example, might present a more compelling opportunity. If valued at its historical average forward P/E, it could see an 18% upside. If it were to reach the valuation of its peers, the upside could be as high as 33%, suggesting a potentially better deal than Coca-Cola at current levels.
The Margin of Safety: Benjamin Graham’s Imperative
The concept of a margin of safety, championed by Benjamin Graham, is crucial. It advocates buying a stock at a price significantly below its intrinsic value to protect against unforeseen events and analytical errors. As Seth Klarman noted, valuation is an imprecise art, making a safety buffer essential.
Warren Buffett, a disciple of Graham, emphasizes understanding the business thoroughly. For stable, well-understood businesses like Coca-Cola, he might accept a smaller margin of safety, even buying at closer to “a dollar on the dollar” if confident in the business’s predictability. However, he prefers finding opportunities at “40 cents on the dollar.” For more volatile or uncertain businesses, a larger margin of safety is warranted.
Limitations exist with relative valuation. If an entire industry is overvalued, a company might appear cheap relative to its peers but still be a poor investment. Furthermore, historical averages and peer comparisons assume that underlying business conditions remain constant, which is often not the case.
Discounted Cash Flow (DCF): Valuing Future Earnings
The Discounted Cash Flow (DCF) model offers a more intrinsic valuation approach, focusing on the present value of a company’s expected future free cash flows. Warren Buffett defines a company’s intrinsic value as the sum of all future cash flows, discounted back to the present at an appropriate rate.
Forecasting Free Cash Flow
The DCF process involves three key questions, as posed by Buffett: How much cash will the business generate? When will it generate that cash? And how certain are those cash flows?
The first step is to estimate future free cash flow (FCF), which is the cash a company generates after accounting for capital expenditures (CapEx). This is calculated as cash from operations minus CapEx. Historical FCF data, readily available through financial data providers or company filings (like the 10-K), serves as a basis for projections. For instance, Coca-Cola’s historical FCF might be adjusted for non-recurring items, such as a $6 billion tax-related item impacting 2024 results.
Projections typically extend 5-10 years, with a terminal value used to represent cash flows beyond that period. This terminal value can be calculated using an exit multiple (based on a future valuation multiple like Price-to-FCF) or the perpetuity growth method (assuming a constant, modest growth rate indefinitely).
Forecasting growth rates requires careful consideration. Unrealistic optimism, such as projecting 15% annual growth for a large, established company, is often unsustainable. Reality checks include historical company and industry growth rates. Coca-Cola has historically grown FCF by approximately 3.5% annually since 2019. The global carbonated beverage industry is projected to grow around 6.4% annually from 2025-2030. Based on this, a conservative future growth rate of around 4% might be assumed.
The Crucial Role of the Discount Rate
The second question—when will the cash be generated?—addresses the time value of money. Money received today is worth more than money received in the future due to its potential earning capacity and risk. This is incorporated through a discount rate.
The discount rate reflects the required rate of return for an investment, considering its risk. A higher discount rate implies greater risk or opportunity cost, leading to a lower present value. Buffett suggests using a rate significantly higher than government bond yields. For example, if long-term government bonds yield 4.5%, an investor might seek a return of at least 7.5% (4.5% + 3% spread) for a business investment.
Applying different discount rates to Coca-Cola’s projected cash flows yields vastly different valuations. A 10% discount rate might result in a valuation of $260 billion, suggesting a loss at current prices. A 5% discount rate could lead to a valuation of $394 billion, indicating a potential purchase with a 20% margin of safety.
The perpetuity growth method for terminal value calculation, assuming a 3% growth rate (slightly above inflation), might suggest a DCF valuation of $248 billion for Coca-Cola. The exit multiple method, using a Price-to-FCF multiple of 33 (based on historical medians), could yield a valuation of around $613 billion. The discrepancy highlights the sensitivity of DCF models to assumptions.
Certainty and Predictability: Buffett’s Preference
Buffett’s third question, “how certain are you?” underscores the importance of predictability. He favors businesses with stable, predictable futures, viewing significant change as a threat rather than an opportunity. Companies like Coca-Cola, whose core products and business models have remained consistent for decades, align with this philosophy. This contrasts with rapidly evolving sectors where technological disruption is constant, making long-term cash flow predictions highly uncertain.
While some investors might adjust for uncertainty by increasing the discount rate or margin of safety, Buffett tends to avoid businesses where such adjustments are necessary, preferring those that are inherently predictable.
A Third Path: Practical Valuation Tools
While DCF and relative valuation are powerful, they can be complex. Platforms like Ticker.com offer integrated tools that simplify the valuation process. These tools allow users to input key financial data—sales, margins, tax rates, buybacks, dividends, and valuation multiples—and generate valuation charts based on historical data and analyst estimates.
For example, using Ticker’s valuation tool for Coca-Cola, with a projected 4% revenue growth rate aligning with analyst forecasts and a 7.5% discount rate, suggests a value of approximately $91 per share by the end of 2029, implying a 6.2% annual return. For AG Barr, using similar assumptions and a historical Price-to-FCF multiple of 28, the valuation points to a potential 9.3% annual return over 4.5 years, translating to a 22% margin of safety against a target return of 7.5%.
Conclusion: A Multifaceted Approach
As Charlie Munger advises, there is no single, easy method to mechanically determine intrinsic value. Effective stock valuation requires employing multiple techniques, models, and extensive experience. Combining relative valuation, DCF analysis, and modern financial tools, while always maintaining a critical eye on assumptions and seeking a margin of safety, provides a robust framework for making informed investment decisions.
“Price is what you pay; value is what you get.” – Warren Buffett
Source: How to Tell When a Stock is Cheap/Expensive (Masterclass in Stock Valuation) (YouTube)