From the rolling foothills of Colorado’s Front Range, geopolitical analyst Peter Zeihan delivers a stark warning: the United States isn’t building factories fast enough to brace for a world without China’s manufacturing dominance. As tensions escalate in global trade and supply chains fray, one key metric—total construction spending on manufacturing capacity—stands out as a barometer of America’s preparedness. Tracked by the Federal Reserve and the U.S. Census Bureau, this figure reveals how much the nation is investing in expanding its industrial base. In an era of deglobalization, where tariffs fly and alliances shift, understanding this data isn’t just for economists; it’s essential for grasping the future of American economic security. As of mid-2025, the numbers paint a picture of progress stalled by policy uncertainty, raising questions about whether the U.S. can fill the void left by a potentially collapsing Chinese economy.
Decoding the Metric: What is Manufacturing Construction Spending?
At its core, manufacturing construction spending measures the dollar value of new builds, expansions, and improvements to factories and industrial facilities across the United States. Sourced from the U.S. Census Bureau’s Value of Construction Put in Place Survey (VIP), the data is reported monthly and adjusted for seasonal variations to provide an annualized rate. This allows analysts to track trends without the noise of weather-related slowdowns or holiday lulls. The figures encompass both private and public sector investments, though the bulk—over 95%—comes from private enterprises building everything from semiconductor plants to automotive assembly lines.
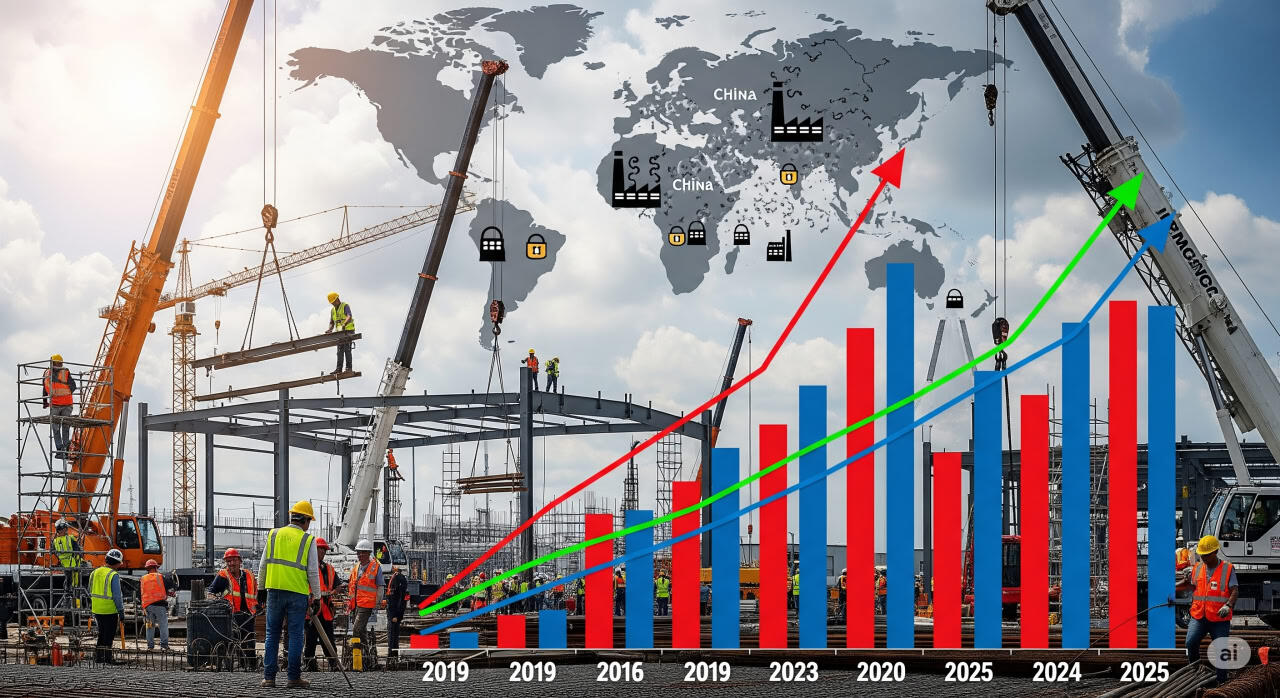
Why does this matter? In a globalized economy, the U.S. has long relied on cheap overseas labor and efficient supply chains for manufactured goods. But as geopolitical risks mount, this dependency becomes a liability. The metric serves as a proxy for reshoring—the process of bringing manufacturing back home—and onshoring, where new capacity is built domestically to serve local markets. According to the Federal Reserve Economic Data (FRED) series TLMFGCONS, this spending hit a record high of $238.4 billion in June 2024 before dipping slightly in early 2025. For context, that’s more than double the levels seen at the end of 2021, when spending hovered around $90 billion annually.
The data isn’t just numbers on a chart; it reflects real-world decisions by corporations like Intel, TSMC, and General Motors. For instance, the surge in computer and electronics manufacturing construction—driven by subsidies from the CHIPS and Science Act—accounts for nearly half of the recent growth. Yet, as we’ll explore, external factors like pandemics, policy changes, and trade wars can swing these investments wildly. Economists at the Brookings Institution note that sustained high spending here could add 1-2% to annual GDP growth through job creation and productivity gains, but stagnation risks supply shortages and inflation.
Historical Trends: From Lows in 2019 to Peaks in 2024
To appreciate the current landscape, let’s rewind to 2019. Manufacturing construction spending was modest, averaging about $75 billion annually on a seasonally adjusted basis. This was a period of relative stability in global trade, with U.S. companies content to outsource to China and Mexico. The Trump administration’s initial tariffs on steel and aluminum in 2018 had sparked some reshoring talk, but the data showed little movement. Spending ticked up slightly to $78 billion by year’s end, but it was far from transformative.
Then came 2020, a year defined by chaos. The COVID-19 pandemic exposed the fragility of global supply chains, as lockdowns in China halted shipments of everything from medical supplies to electronics. Construction spending plummeted to an average of $65 billion, the lowest in over a decade. Uncertainty reigned: Would the virus lead to permanent shutdowns? How many workers would be lost? Early fatality rates in hotspots like New York approached 4%, and treatments were rudimentary. Businesses paused investments, waiting for clarity. As Zeihan points out, this made the Trump era look worse than it was—COVID, not policy, was the primary culprit.
Recovery began in 2021, but it was uneven. Spending rebounded to around $85 billion as vaccines rolled out and stimulus checks fueled demand. However, lingering supply disruptions, like the semiconductor shortage that idled auto plants, highlighted the need for domestic capacity. By year’s end, real (inflation-adjusted) spending had started climbing, per a 2023 Treasury Department analysis, which noted a doubling since late 2021 when adjusted for rising construction costs.
The real acceleration hit in 2022-2024 under the Biden administration. Annual spending surged from $100 billion in 2022 to $202 billion in 2023 and $235 billion in 2024. Year-over-year growth peaked at 16.2% from 2023 to 2024, driven by landmark legislation. The Infrastructure Investment and Jobs Act (IIJA), CHIPS Act, and Inflation Reduction Act (IRA) injected hundreds of billions in subsidies and tax credits for clean energy, semiconductors, and electric vehicles. For example, the CHIPS Act alone allocated $52 billion, spurring projects like TSMC’s $40 billion Arizona fab and Intel’s $20 billion Ohio expansion.
But government wasn’t the sole driver. Private sector investments accounted for about 80% of the rise, as companies anticipated deglobalization. Firms like Samsung and Micron poured funds into U.S. facilities to mitigate risks from Taiwan Strait tensions. By May 2024, monthly spending hit $235.4 billion on a seasonally adjusted annual rate (SAAR), a far cry from 2019’s lows.
Entering 2025, the momentum faltered. January spending was $235.7 billion SAAR, but by May, it dipped to $226.4 billion—a 0.1% drop from April’s $226.7 billion and 3.8% below May 2024. Year-to-date through May 2025, total spending was $92.6 billion, down 1.7% from $94.3 billion in 2024’s comparable period. This flatline aligns with broader economic caution, but as we’ll see, policy plays a starring role.
The Policy Puzzle: Biden’s Boost Versus Trump’s Tariffs
The Biden years (2021-2024) marked a golden era for industrial revival, but the data inflates the administration’s impact. While the IIJA, IRA, and CHIPS Act funneled over $1 trillion into infrastructure and manufacturing, only about 20% of the spending surge directly stemmed from federal dollars. The rest? Organic corporate responses to a changing world. Supply chain disruptions from COVID, Russia’s Ukraine invasion, and U.S.-China tech wars convinced executives that relying on foreign factories was risky. A McKinsey report from 2023 estimated that 60% of Fortune 500 companies planned to reshore at least 10% of operations by 2025.
Take the semiconductor sector: Pre-2020, the U.S. produced just 12% of global chips. Post-CHIPS Act, announcements for new fabs totaled over $200 billion, with spending in computer and electronics manufacturing quadrupling since 2022. This wasn’t just subsidies; it was strategic hedging. Companies like Apple diversified away from China, boosting U.S. capacity in allied nations too.
Fast-forward to 2025 under President Trump 2.0. The administration has unleashed a torrent of tariffs—149 new policies since January 20, 2025, by some counts—targeting everything from Chinese EVs to Mexican steel. Proponents argue this protects American jobs and forces reshoring. Critics, including Zeihan, see it as disruptive. The constant changes create uncertainty: Will a new tariff hike input costs mid-project? Businesses are completing existing builds—like the $15 billion Volkswagen EV plant in Tennessee—but new groundbreakings are scarce.
Data bears this out. After peaking in late 2024, spending flatlined in 2025. Green-field projects, those starting from scratch, have slowed dramatically. Trump’s boasted deals, such as hypothetical pacts with foreign automakers, remain announcements without shovels in the ground. Economists at the Peterson Institute for International Economics warn that while tariffs might encourage long-term investment, short-term volatility could shave 0.5% off GDP growth in 2025.
This policy whiplash underscores a broader debate: incentives versus protectionism. Biden’s approach used carrots—tax credits and grants—to lure investment. Trump’s uses sticks—tariffs—to punish imports. Both aim at the same goal, but the data suggests a hybrid might be needed. As Federal Reserve Chair Jerome Powell noted in a 2025 speech, “Sustained industrial growth requires policy stability to unlock private capital.”
Geopolitical Backdrop: Preparing for China’s Potential Collapse
Zeihan’s core concern isn’t domestic policy—it’s China. For decades, China has been the world’s factory, producing 28% of global manufactured goods. But demographic headwinds loom: an aging population, with the working-age cohort shrinking by 5 million annually, erodes its labor advantage. Add a real estate crisis (Evergrande’s collapse wiped out $300 billion), debt at 300% of GDP, and U.S. tech restrictions, and Zeihan predicts a collapse within eight years—accelerated by tariffs.
If China falters, global manufacturing could contract by 15-20%, per IMF estimates. The U.S., importing $500 billion annually from China, would face shortages in electronics, pharmaceuticals, and consumer goods. Building domestic capacity is imperative. Yet, current spending levels, while improved, fall short. To replace just 20% of Chinese imports, the U.S. might need $500 billion in annual construction—double today’s peaks.
Examples abound of proactive moves. The IRA spurred $100 billion in clean energy factories, like Tesla’s Nevada expansion. But gaps remain in textiles, rare earths, and basic chemicals. A 2025 Council on Foreign Relations report urges tripling spending to $700 billion by 2030, warning that without it, inflation could spike 3-5%.
Broader Economic Implications: Jobs, Inflation, and Global Shifts
Rising manufacturing construction isn’t isolated; it’s part of a non-residential building boom. Overall construction spending hit $2.14 trillion SAAR in May 2025, down slightly from 2024 but up 50% from 2019. This creates jobs: the sector employs 8.2 million, with 300,000 added since 2024. Wages average $35/hour, boosting middle-class growth.
However, challenges lurk. Construction costs rose 20% since 2021 due to labor shortages and material inflation. Tariffs exacerbate this, increasing steel prices 15%. If spending stalls, supply bottlenecks could fuel inflation, as seen in 2021’s chip crisis.
Internationally, the U.S. surge is unique. While Europe invests in green tech, spending there grew just 5% annually. Japan and Germany focus on automation, but not scale. China’s own industrial spending is flatlining amid economic woes, per World Bank data.
What Lies Ahead: Monitoring for a Resilient Future
As Zeihan emphasizes, watch this metric closely. If it climbs above $250 billion SAAR in late 2025, it signals adaptation—perhaps through tariff adjustments or new incentives. A decline below $200 billion spells trouble, risking economic vulnerability.
Policymakers could help by streamlining permits (currently taking 2-3 years) and investing in workforce training. Corporations might accelerate with public-private partnerships. Ultimately, this isn’t about politics; it’s about survival in a deglobalized world. Track the data via FRED or Census Bureau releases—your economic future depends on it.
https://www.census.gov/construction/c30/current/index.html
https://www.census.gov/construction/c30/c30index.html
https://fred.stlouisfed.org/series/TLMFGCONS
https://ycharts.com/indicators/us_total_manufacturing_construction_spending
https://tradingeconomics.com/united-states/construction-spending
https://tradingeconomics.com/united-states/total-construction-spending-manufacturing-fed-data.html